Saturday, February 11, 2006
The Good, the Bad, and the Ugly
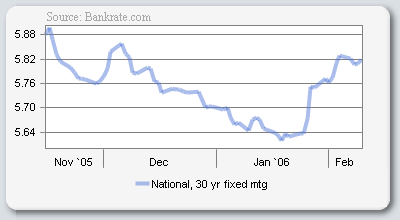
As reported earlier mortgage rates shot up when it was reported that American weren't saving their money.
the dollar has reversed it's recent slip and has started surging against the Euro again. I believe this will be the long term trend. A principle reason is the taxing structure of European countries versus the United States. We tax primarily based on personal profits and corporate profits. Overseas their taxes are much more consumption based (fuel prices over 4 times higher than ours because of taxes). Results speak for themselves Americans live the best life. But the point is out Treasury has a much more wild roller coaster ride with inflows of cash. During the recession our dollar crashed as we pumped out the treasuries to keep the government flowing. Tomorrow will be a better day for the US Treasury Department. A reduction in the needs to produce cash by borrowing will be the trend (at least if we get the tax and spend bush Team out of the office and replace them with a fiscal conservative like Bill Clinton).
We have an election coming soon which will focus heavily on the damage Bush has done to our economy going on at the same time as massive increase corporate earnings and their taxes being paid. The dollar strengthens will be happening for the next 5 to 10 years.
The surging dollar should bring the rate on the 10 year treasury back down, which is the bench mark for mortgage rates.
The next great news is the 1st wave of baby boomers are now turning 60. More tracts of land like the one TOL Brothers bought in Arizona will be purchased over the next 10 years. The migration has already begun. While we here talk of the bubble in LA, DC< and NY. Delware beaches, Maryland Mountains, Utah's scenic desert are all experiencing a boom. This is just the tip of the ice berg.
With all this being said. only a damn fool buys a stock at the 52 week low. The hard cold fact is there is less risk buying a stck at the 52 week high than there is at the 52 week low. Don't believe me? Take nearly any 5 to 10 year chart. Start at the left edge and cover the right side with a piece of papaer. If you slide the piece of papaer over to the right. Pretend you buy at every new 52 week low. You will see just how dangerious it is to buy a cheap stock.
![]()
Subscribe to Posts [Atom]