Friday, January 06, 2006
The two United States of America

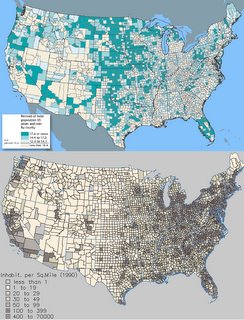
The upper map shows the percent of population of Americans over the age of 65. The lower map shows total population density.
Notice how the top map has a low percent of seniors along Lake Michigan, yet the total population density along lake Michigan is extremely high. Land along lake Michigan offers great paying jobs with a lovely living environment. But as nice as it is to live along lake Michigan, it is relatively expensive compare to rural Wisconsin, Illinois, Indiana, and Michigan. Now checkout the land along the Wisconsin Michigan border, Northeast Michigan, Central Illinois, Central Indiana. These lands are cheap, but few jobs exist here. It is possible to live in this area and visit your grand kids along Lake Michigan. Notice how there is a jump in population of 65 and older, yet the total population took a dive in these locations?
Now checkout the Northeast. Along the coast you have an extreamlly high total density population and a low 65 and older density population. Yet when you move a little west into the mountains the population density of 65 years and older increases while the total population density takes a dive. You can see this pattern everywhere in the USA. Whether it's the Portland Oregon high density population with low 65 and older with the reverse outside the metropolitan area. Or California's high coastal total population/low 65 and older population with the reverse out in the desert and hills.
The numbers don't lie. When the baby boomer hit 65, many will migrate. Homes will be built for them while their previous homes will be converted into crack houses.
Subscribe to Comments [Atom]