Saturday, March 11, 2006
The Energy Bubble
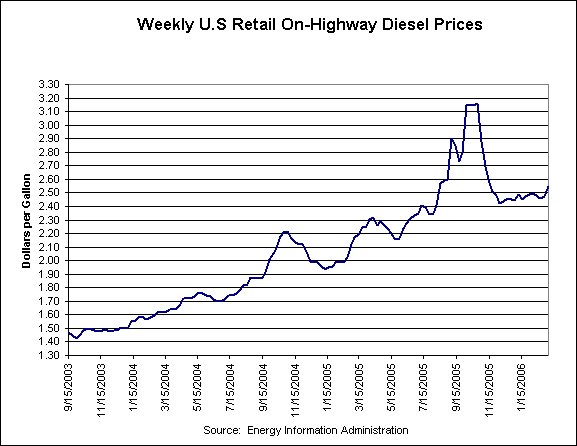
If you disagree with me on this chart, all else beyond this point means nothing. But I look at the diesel price chart and see the obvious impact of a trading bubble being created. Everyone that buys into the energy commodity sells for for a bit of a profit. Active trading drives the price up. Kinda of like activity in housing. You can see the clear progressing line that the chart has been following. But the laws of supply and demand have no relationship with this chart. Oil trading above $60 a barrel is a trading number. The fact is more and more oil is produced every day for less and less money. What can send the produce fuel commodities falling? A new refinery? Anybody knows what's going on south of our border where 50% of our oil comes from (that's right the middle east is only 15% how we ever allowed those clowns to manipulate what we think oil is worth is beyond my thinking)?
Mainstream thought here is that rising energy prices will drive consumer cost up, driving inflation, driving interest rates up.
For all it's worth there is another thought. Energy is a tax on the economy that slows the economy down. It does not makes sense to tax the economy twice with raising the interest rates.
But here is my though on the matter...
The diesel cost has a real impact on the economy. Every truck you see on the road gets about 3 miles to the gallon!!! This of course impacts the costs on everything you buy whether it's food, cloths, cars, furniture, ects., The more you are forced to spend, the less government can tax the people. We talked about the surging US Dollar and how because we have a system based off profits versus the European system of consumption. Our government should have a greater in flow of cash than European countries and our dollar should surge against them. AND IT HAS. The rising dollar is why despite rate increase after rate increase from the Feds our T-Bill rates have remained low keeping our mortgage rates low. But what happens if oil crashes?
If the cost of energy is a tax on all countries ability to produce wealth. Then a crash in oil should create a surge in a world currency. But in this world of relativity can this be measure? IT CAN AND IT WILL...
Gold will crash and burn with the collasp of energy cost.
Brillant
Dogcrap Green - November 2005
Three things will happen.
1) A stampede to tap bloated equity will drive boomers out of suburbia’s high price market and into a lower price rural setting. After all if you remove the need to be employed. You can buy a beautiful house on the beach, lake, mountain, sunshine, and so on for pennies on the dollar.
2) Real estate in the bloated suburban areas will crash in price. Real estate in the rural low price settings will rise in value.
3) Home builders will continue making money selling to the great migration of baby boomers tomorrow. Just as they made money off their migration into the burbs.
If you live in a trendy high price neighbor, I’d consider any other options you have. And whatever you do. Do not listen to the clowns who are attempting to sound smart by telling you to short the home builders.
Hot real estate prices extend to rural land
By Sue Kirchhoff, USA TODAY March 9, 2006
WASHINGTON — The fastest-growing commodity in Florida farm country last year? Land values, which jumped 50% to 88%, depending on the area.
While not quite as dramatic, a similar story has been playing out across the country. Rural real estate prices soared 11% to an average of $1,510 per acre from Jan. 1, 2004, to Jan. 1, 2005. That's the fastest annual increase since 1981 and the biggest on record in dollar terms, according to the U.S. Department of Agriculture (USDA).
More recent data from Iowa State University show prices in Iowa rose nearly 11% in 2005. In Texas, the median rural land price rose 15% in 2005. State and USDA estimates differ because of sampling times and techniques but show similar trends.
"Those ... are whopping increases," says Charles Gilliland of the Texas A&M Real Estate Center. "Everybody is waiting for it to level off."
The escalation is the steepest since the response to the fat years of the 1970s, when world food prices soared and Agriculture secretary Earl Butz exhorted farmers to get bigger or get out. Many expanded, only to face a crisis in the mid-'80s when the good times ended. Land values sank 27% from 1982 to 1987.
Different from last land rush
While the current price run-up is not without risk, economists and real estate agents call it much different than the previous land rush. Purchases are not as highly leveraged. Farm income has been at record or near-record levels in the past several years, but land sales are not driven solely, or even mainly in many areas, by farm expansion.
A majority of buyers in some regions are real estate developers, individuals who want to convert a ranch or farm to a recreational purpose, such as hunting or fishing, or those who see land as a good investment given low interest rates. Farmland that could be immediately developed sold for a big premium in 2005 — more than $6,050 an acre, according to USDA.
"This is a starkly different episode," says Mark Drabenstott, director of the Kansas City Federal Reserve Bank's Center for the Study of Rural America. "We've seen considerable off-farm investors interested in farmland, in part a lingering result of the (low) stock market performance of recent years."
James Vine of San Antonio's Vine and Associates, an appraisal and consulting firm, doesn't see the value of many properties fluctuating with changes in the farm economy, noting that 40% to 50% of the sales he's recently seen are cash transactions.
"This recreational deal has taken over the rural land market, except in markets where there is no romance or row crop agriculture still makes sense," says Vine, noting a recent Texas drought "didn't impact the prices of real estate. It kept going up."
Unlike homeowners taking out loans against the rapidly rising value of their houses in the past few years, farmers aren't borrowing as heavily against their land.
"Farm income to farmland values have been improving over the past two years, because farm income has been so high," says John Anderlik of the Federal Deposit Insurance Corp., an expert on rural lending. "Bubble-like factors have been declining."
Sales fueled by tax law
Still, as the Kansas City Fed noted in a recent publication, the price increases are "raising the eyebrows" of lenders and producers. The record housing market, which has helped propel land sales, may be slowing. In a large swath of the Midwest, the value of the land is tied at least partly to federal crop supports. Anderlik notes that farm subsidies, accounting for about a third of net farm income since 1997, are under attack, in world trade talks and from Congress.
Many sales have been fueled by a federal tax provision called a 1031 exchange that allows an owner to sell an income, business or investment property, replace it with like-kind property and defer capital gains taxes.
Growers near urban areas have been selling to developers, then purchasing more-isolated properties, artificially escalating prices in outlying areas. An August study by the Illinois Society of Professional Farm Managers and Rural Appraisers found more than half of recent sales used the 1031 provision.
Zbynek Zidlicky, a former corn and soybean producer, sold his 78-acre farm near Oswego, Ill., to a developer several years ago. Using the 1031 provision, he then bought four properties out of the area.
"A lot of people do 1031 exchanges, so that filters down and increases the price on other properties," Zidlicky said, adding the price in some areas has doubled since he bought.
John Reynolds, a professor who conducts the annual farmland value survey for the University of Florida, says the 1031 provisions have helped push land price inflation in that state northward from fast-growing urban counties.
"The income stream from agriculture just can't support these prices," Reynolds says.
For many growers, particularly older farmers, it makes sense to sell while prices are at peaks. But the price run-up has made it hard for some younger growers to buy land.
Conservation efforts
The American Farmland Trust, which seeks to preserve farmland, notes that in 1999 the national average cost for agricultural conservation easement programs — voluntary, binding agreements that limit land uses or prevent future development — was $1,519 per acre. In 2004, it was $2,899 per acre.
High prices also make it tougher to keep protected land in the hands of farmers, says Jennifer Dempsey of American Farmland Trust. "Someone could come in and say, 'Here's 50 acres that are protected,' and they can make it their private estate."
Appraisers and real estate agents expect prices to slow but haven't seen a lot of firm evidence of it yet.
"It's not going to burst at all. In fact, I continue to see a strong rural real estate market for years to come," says Ray Brownfield, a real estate broker at John Greene Land Co. in Illinois. "It may not be as aggressive as it was because interest rates are starting to climb."
Vine says he's seen some softening in the volume of sales but says that may be because it's getting harder to find enough land. That's echoed by Florida's Reynolds, who now works as an appraiser at a Florida firm called Natural Resource Planning Services.
"Our firm also has a brokerage division, and we simply can't find enough land," Reynolds says.
RISING FARM PRICES
State 2005 avg. land value (in dollars per acre) Pct. change from 2004
Alabama $2,050 10.2%
Arizona $1,750 9.4%
Arkansas $1,820 10.3%
California $4,160 9.5%
Colorado $845 9.0%
Connecticut $10,800 5.9%
Delaware $8,400 40.0%
Florida $3,700 19.4%
Georgia $2,590 10.2%
Idaho $1,480 8.8%
Illinois $2,900 11.1%
Indiana $3,050 10.1%
Iowa $2,490 13.2%
Kansas $800 11.9%
Kentucky $2,200 10.0%
Louisiana $1,680 6.3%
Maine $1,950 5.4%
Maryland $7,900 38.6%
Massachusetts $10,500 6.1%
Michigan $3,150 7.9%
Minnesota $2,030 12.8%
Mississippi $1,580 6.8%
Missouri $1,740 10.1%
Montana $445 8.5%
Nebraska $910 10.3%
Nevada $550 10.0%
New Hampshire $3,450 6.2%
New Jersey $10,300 5.6%
New Mexico $290 9.4%
New York $1,880 5.6%
North Carolina $3,570 8.2%
North Dakota $500 9.9%
Ohio $3,180 8.5%
Oklahoma $805 8.1%
Oregon $1,350 8.0%
Pennsylvania $4,000 9.6%
Rhode Island $11,200 9.8%
South Carolina $2,330 8.4%
South Dakota $570 14.0%
Tennessee $2,700 8.0%
Texas $925 8.2%
Utah $1,230 7.0%
Vermont $2,300 7.0%
Virginia $3,900 21.9%
Washington $1,650 7.8%
West Virginia $1,600 6.7%
Wisconsin $2,850 14.0%
Wyoming $350 11.1%
Source: Department of Agriculture's National Agricultural Statistics Service
![]()
Subscribe to Posts [Atom]